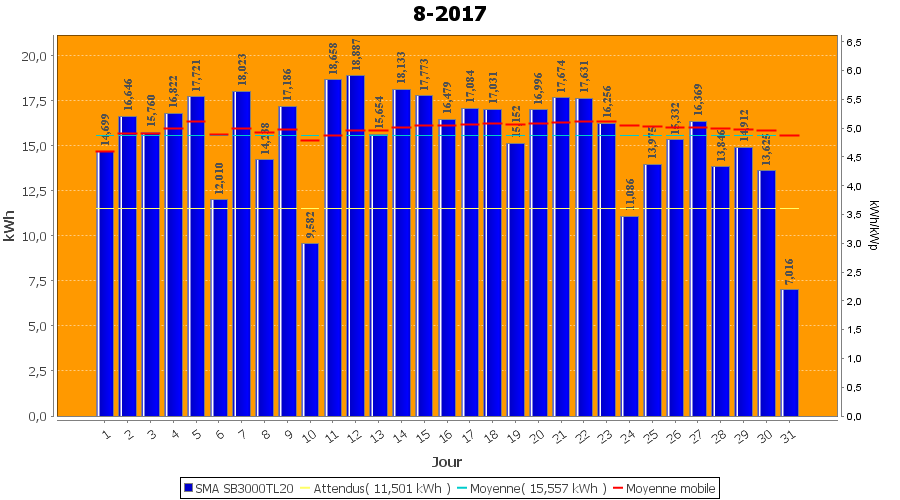
Rendement par jour
| Onduleur | Wp | Initial | kWh/kWp | Production actuelle | kWh/kWp | % | Production | kWh/kWp | % |
|---|
| SMA SB3000TL20 | 2996 | 356,524 | 119,0 | 482,256 | 161,0 | 135,3% | 482,256 | 161,0 | 135,3% |
| Jour | | Production(kWh) | kWh/kWp | Co2 (Kg) | Gains | % |
|---|
| 1-8-2017 | | 14,699 | 4,9 | 6,798 | € 0,00 | 3,0 |
| 2-8-2017 | | 16,646 | 5,6 | 7,699 | € 0,00 | 3,5 |
| 3-8-2017 | | 15,760 | 5,3 | 7,289 | € 0,00 | 3,3 |
| 4-8-2017 | | 16,822 | 5,6 | 7,780 | € 0,00 | 3,5 |
| 5-8-2017 | | 17,721 | 5,9 | 8,196 | € 0,00 | 3,7 |
| 6-8-2017 | | 12,010 | 4,0 | 5,555 | € 0,00 | 2,5 |
| 7-8-2017 | | 18,023 | 6,0 | 8,336 | € 0,00 | 3,7 |
| 8-8-2017 | | 14,238 | 4,8 | 6,585 | € 0,00 | 3,0 |
| 9-8-2017 | | 17,186 | 5,7 | 7,948 | € 0,00 | 3,6 |
| 10-8-2017 | | 9,582 | 3,2 | 4,432 | € 0,00 | 2,0 |
| 11-8-2017 | | 18,658 | 6,2 | 8,629 | € 0,00 | 3,9 |
| 12-8-2017 | | 18,887 | 6,3 | 8,735 | € 0,00 | 3,9 |
| 13-8-2017 | | 15,654 | 5,2 | 7,240 | € 0,00 | 3,2 |
| 14-8-2017 | | 18,133 | 6,1 | 8,386 | € 0,00 | 3,8 |
| 15-8-2017 | | 17,773 | 5,9 | 8,220 | € 0,00 | 3,7 |
| 16-8-2017 | | 16,479 | 5,5 | 7,621 | € 0,00 | 3,4 |
| 17-8-2017 | | 17,084 | 5,7 | 7,901 | € 0,00 | 3,5 |
| 18-8-2017 | | 17,031 | 5,7 | 7,877 | € 0,00 | 3,5 |
| 19-8-2017 | | 15,152 | 5,1 | 7,008 | € 0,00 | 3,1 |
| 20-8-2017 | | 16,996 | 5,7 | 7,861 | € 0,00 | 3,5 |
| 21-8-2017 | kWhGraph | 17,674 | 5,9 | 8,174 | € 0,00 | 3,7 |
| 22-8-2017 | kWhGraph | 17,631 | 5,9 | 8,154 | € 0,00 | 3,7 |
| 23-8-2017 | kWhGraph | 16,256 | 5,4 | 7,518 | € 0,00 | 3,4 |
| 24-8-2017 | kWhGraph | 11,086 | 3,7 | 5,127 | € 0,00 | 2,3 |
| 25-8-2017 | kWhGraph | 13,975 | 4,7 | 6,463 | € 0,00 | 2,9 |
| 26-8-2017 | kWhGraph | 15,332 | 5,1 | 7,091 | € 0,00 | 3,2 |
| 27-8-2017 | kWhGraph | 16,369 | 5,5 | 7,571 | € 0,00 | 3,4 |
| 28-8-2017 | kWhGraph | 13,846 | 4,6 | 6,404 | € 0,00 | 2,9 |
| 29-8-2017 | kWhGraph | 14,912 | 5,0 | 6,897 | € 0,00 | 3,1 |
| 30-8-2017 | kWhGraph | 13,625 | 4,5 | 6,302 | € 0,00 | 2,8 |
| 31-8-2017 | kWhGraph | 7,016 | 2,3 | 3,245 | € 0,00 | 1,5 |
| Ajoutť | | 482,256 | | 223,043 | € 0,00 | |