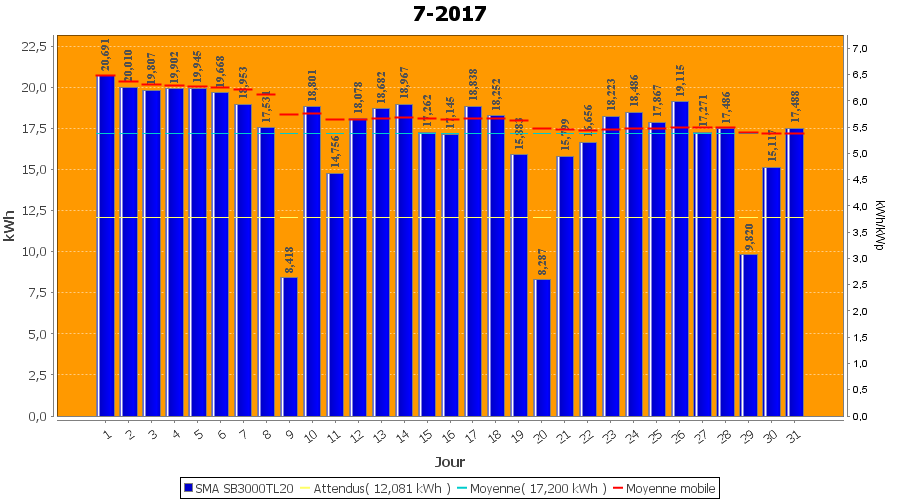
Rendement par jour
| Onduleur | Wp | Initial | kWh/kWp | Production actuelle | kWh/kWp | % | Production | kWh/kWp | % |
|---|
| SMA SB3000TL20 | 2996 | 374,500 | 125,0 | 533,205 | 178,0 | 142,4% | 533,205 | 178,0 | 142,4% |
| Jour | | Production(kWh) | kWh/kWp | Co2 (Kg) | Gains | % |
|---|
| 1-7-2017 | | 20,691 | 6,9 | 9,570 | € 0,00 | 3,9 |
| 2-7-2017 | | 20,010 | 6,7 | 9,255 | € 0,00 | 3,8 |
| 3-7-2017 | | 19,807 | 6,6 | 9,161 | € 0,00 | 3,7 |
| 4-7-2017 | | 19,902 | 6,6 | 9,205 | € 0,00 | 3,7 |
| 5-7-2017 | | 19,945 | 6,7 | 9,225 | € 0,00 | 3,7 |
| 6-7-2017 | | 19,668 | 6,6 | 9,096 | € 0,00 | 3,7 |
| 7-7-2017 | | 18,953 | 6,3 | 8,766 | € 0,00 | 3,6 |
| 8-7-2017 | | 17,531 | 5,9 | 8,108 | € 0,00 | 3,3 |
| 9-7-2017 | | 8,418 | 2,8 | 3,893 | € 0,00 | 1,6 |
| 10-7-2017 | | 18,801 | 6,3 | 8,695 | € 0,00 | 3,5 |
| 11-7-2017 | | 14,756 | 4,9 | 6,825 | € 0,00 | 2,8 |
| 12-7-2017 | | 18,078 | 6,0 | 8,361 | € 0,00 | 3,4 |
| 13-7-2017 | | 18,682 | 6,2 | 8,640 | € 0,00 | 3,5 |
| 14-7-2017 | | 18,967 | 6,3 | 8,772 | € 0,00 | 3,6 |
| 15-7-2017 | | 17,262 | 5,8 | 7,984 | € 0,00 | 3,2 |
| 16-7-2017 | | 17,145 | 5,7 | 7,929 | € 0,00 | 3,2 |
| 17-7-2017 | | 18,838 | 6,3 | 8,713 | € 0,00 | 3,5 |
| 18-7-2017 | | 18,252 | 6,1 | 8,442 | € 0,00 | 3,4 |
| 19-7-2017 | | 15,883 | 5,3 | 7,346 | € 0,00 | 3,0 |
| 20-7-2017 | | 8,287 | 2,8 | 3,833 | € 0,00 | 1,6 |
| 21-7-2017 | | 15,799 | 5,3 | 7,307 | € 0,00 | 3,0 |
| 22-7-2017 | | 16,656 | 5,6 | 7,704 | € 0,00 | 3,1 |
| 23-7-2017 | | 18,223 | 6,1 | 8,428 | € 0,00 | 3,4 |
| 24-7-2017 | | 18,486 | 6,2 | 8,550 | € 0,00 | 3,5 |
| 25-7-2017 | | 17,867 | 6,0 | 8,264 | € 0,00 | 3,4 |
| 26-7-2017 | kWhGraph | 19,115 | 6,4 | 8,841 | € 0,00 | 3,6 |
| 27-7-2017 | kWhGraph | 17,271 | 5,8 | 7,988 | € 0,00 | 3,2 |
| 28-7-2017 | kWhGraph | 17,486 | 5,8 | 8,087 | € 0,00 | 3,3 |
| 29-7-2017 | kWhGraph | 9,820 | 3,3 | 4,542 | € 0,00 | 1,8 |
| 30-7-2017 | kWhGraph | 15,117 | 5,0 | 6,992 | € 0,00 | 2,8 |
| 31-7-2017 | kWhGraph | 17,488 | 5,8 | 8,088 | € 0,00 | 3,3 |
| Ajoutť | | 533,205 | | 246,607 | € 0,00 | |