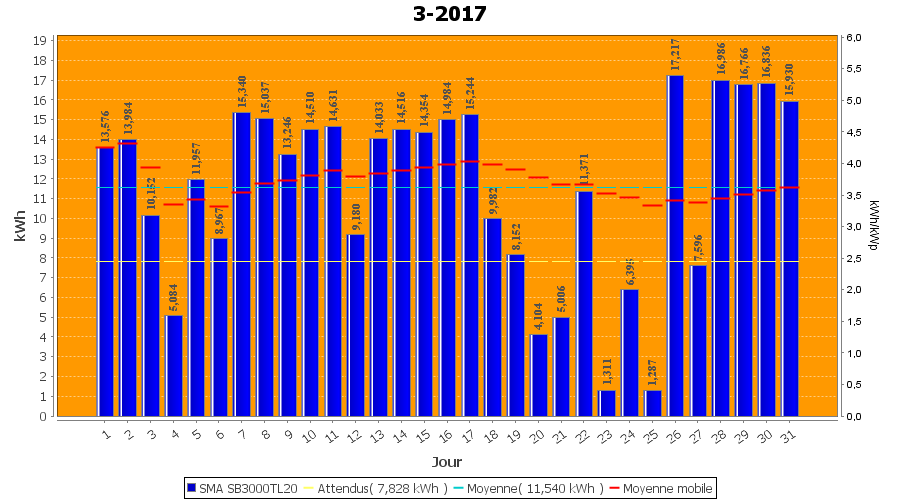
Rendement par jour
| Onduleur | Wp | Initial | kWh/kWp | Production actuelle | kWh/kWp | % | Production | kWh/kWp | % |
|---|
| SMA SB3000TL20 | 2996 | 242,676 | 81,0 | 357,732 | 119,4 | 147,4% | 357,732 | 119,4 | 147,4% |
| Jour | | Production(kWh) | kWh/kWp | Co2 (Kg) | Gains | % |
|---|
| 1-3-2017 | | 13,576 | 4,5 | 6,279 | € 0,00 | 3,8 |
| 2-3-2017 | | 13,984 | 4,7 | 6,468 | € 0,00 | 3,9 |
| 3-3-2017 | | 10,152 | 3,4 | 4,695 | € 0,00 | 2,8 |
| 4-3-2017 | | 5,084 | 1,7 | 2,351 | € 0,00 | 1,4 |
| 5-3-2017 | | 11,957 | 4,0 | 5,530 | € 0,00 | 3,3 |
| 6-3-2017 | | 8,967 | 3,0 | 4,147 | € 0,00 | 2,5 |
| 7-3-2017 | | 15,340 | 5,1 | 7,095 | € 0,00 | 4,3 |
| 8-3-2017 | | 15,037 | 5,0 | 6,955 | € 0,00 | 4,2 |
| 9-3-2017 | | 13,246 | 4,4 | 6,126 | € 0,00 | 3,7 |
| 10-3-2017 | | 14,510 | 4,8 | 6,711 | € 0,00 | 4,1 |
| 11-3-2017 | | 14,631 | 4,9 | 6,767 | € 0,00 | 4,1 |
| 12-3-2017 | | 9,180 | 3,1 | 4,246 | € 0,00 | 2,6 |
| 13-3-2017 | | 14,033 | 4,7 | 6,490 | € 0,00 | 3,9 |
| 14-3-2017 | | 14,516 | 4,8 | 6,713 | € 0,00 | 4,1 |
| 15-3-2017 | | 14,354 | 4,8 | 6,639 | € 0,00 | 4,0 |
| 16-3-2017 | | 14,984 | 5,0 | 6,930 | € 0,00 | 4,2 |
| 17-3-2017 | | 15,244 | 5,1 | 7,050 | € 0,00 | 4,3 |
| 18-3-2017 | | 9,982 | 3,3 | 4,617 | € 0,00 | 2,8 |
| 19-3-2017 | | 8,152 | 2,7 | 3,770 | € 0,00 | 2,3 |
| 20-3-2017 | | 4,104 | 1,4 | 1,898 | € 0,00 | 1,1 |
| 21-3-2017 | | 5,006 | 1,7 | 2,315 | € 0,00 | 1,4 |
| 22-3-2017 | | 11,371 | 3,8 | 5,259 | € 0,00 | 3,2 |
| 23-3-2017 | | 1,311 | 0,4 | 0,606 | € 0,00 | 0,4 |
| 24-3-2017 | | 6,395 | 2,1 | 2,957 | € 0,00 | 1,8 |
| 25-3-2017 | | 1,287 | 0,4 | 0,595 | € 0,00 | 0,4 |
| 26-3-2017 | kWhGraph | 17,217 | 5,7 | 7,963 | € 0,00 | 4,8 |
| 27-3-2017 | kWhGraph | 7,596 | 2,5 | 3,513 | € 0,00 | 2,1 |
| 28-3-2017 | kWhGraph | 16,986 | 5,7 | 7,856 | € 0,00 | 4,7 |
| 29-3-2017 | kWhGraph | 16,766 | 5,6 | 7,754 | € 0,00 | 4,7 |
| 30-3-2017 | kWhGraph | 16,836 | 5,6 | 7,787 | € 0,00 | 4,7 |
| 31-3-2017 | kWhGraph | 15,930 | 5,3 | 7,367 | € 0,00 | 4,5 |
| Ajoutť | | 357,732 | | 165,451 | € 0,00 | |