Rendement par jour
| Onduleur | Wp | Initial | kWh/kWp | Production actuelle | kWh/kWp | % | Production | kWh/kWp | % |
|---|
| SMA SB3000TL20 | 2996 | 92,876 | 31,0 | 192,963 | 64,4 | 207,8% | 192,963 | 64,4 | 207,8% |
| Jour | | Production(kWh) | kWh/kWp | Co2 (Kg) | Gains | % |
|---|
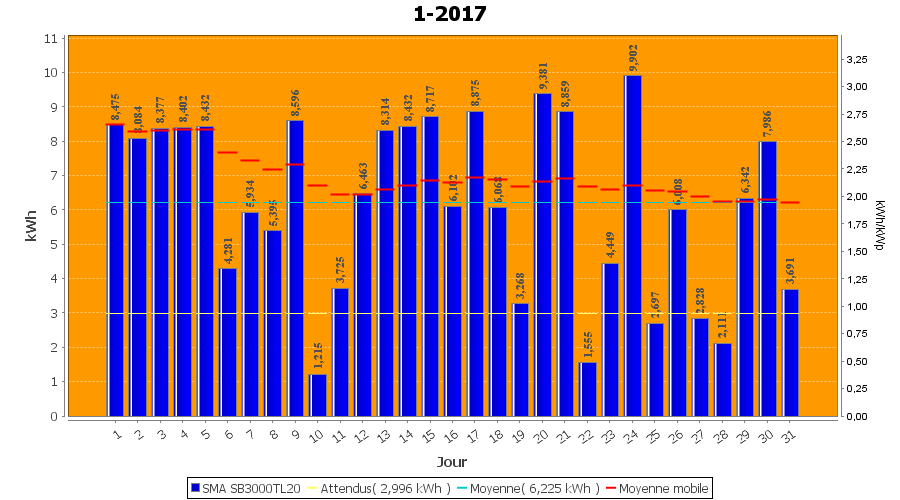
| 1-1-2017 | | 8,475 | 2,8 | 3,920 | € 0,00 | 4,4 |
| 2-1-2017 | | 8,084 | 2,7 | 3,739 | € 0,00 | 4,2 |
| 3-1-2017 | | 8,377 | 2,8 | 3,874 | € 0,00 | 4,3 |
| 4-1-2017 | | 8,402 | 2,8 | 3,886 | € 0,00 | 4,4 |
| 5-1-2017 | | 8,432 | 2,8 | 3,900 | € 0,00 | 4,4 |
| 6-1-2017 | | 4,281 | 1,4 | 1,980 | € 0,00 | 2,2 |
| 7-1-2017 | | 5,934 | 2,0 | 2,744 | € 0,00 | 3,1 |
| 8-1-2017 | | 5,395 | 1,8 | 2,495 | € 0,00 | 2,8 |
| 9-1-2017 | | 8,596 | 2,9 | 3,976 | € 0,00 | 4,5 |
| 10-1-2017 | | 1,215 | 0,4 | 0,562 | € 0,00 | 0,6 |
| 11-1-2017 | | 3,725 | 1,2 | 1,723 | € 0,00 | 1,9 |
| 12-1-2017 | | 6,463 | 2,2 | 2,989 | € 0,00 | 3,3 |
| 13-1-2017 | | 8,314 | 2,8 | 3,845 | € 0,00 | 4,3 |
| 14-1-2017 | | 8,432 | 2,8 | 3,900 | € 0,00 | 4,4 |
| 15-1-2017 | | 8,717 | 2,9 | 4,032 | € 0,00 | 4,5 |
| 16-1-2017 | | 6,102 | 2,0 | 2,822 | € 0,00 | 3,2 |
| 17-1-2017 | | 8,875 | 3,0 | 4,105 | € 0,00 | 4,6 |
| 18-1-2017 | | 6,068 | 2,0 | 2,807 | € 0,00 | 3,1 |
| 19-1-2017 | | 3,268 | 1,1 | 1,511 | € 0,00 | 1,7 |
| 20-1-2017 | | 9,381 | 3,1 | 4,339 | € 0,00 | 4,9 |
| 21-1-2017 | | 8,859 | 3,0 | 4,097 | € 0,00 | 4,6 |
| 22-1-2017 | | 1,555 | 0,5 | 0,719 | € 0,00 | 0,8 |
| 23-1-2017 | kWhGraph | 4,449 | 1,5 | 2,058 | € 0,00 | 2,3 |
| 24-1-2017 | kWhGraph | 9,902 | 3,3 | 4,580 | € 0,00 | 5,1 |
| 25-1-2017 | kWhGraph | 2,697 | 0,9 | 1,247 | € 0,00 | 1,4 |
| 26-1-2017 | kWhGraph | 6,008 | 2,0 | 2,779 | € 0,00 | 3,1 |
| 27-1-2017 | kWhGraph | 2,828 | 0,9 | 1,308 | € 0,00 | 1,5 |
| 28-1-2017 | kWhGraph | 2,111 | 0,7 | 0,976 | € 0,00 | 1,1 |
| 29-1-2017 | kWhGraph | 6,342 | 2,1 | 2,933 | € 0,00 | 3,3 |
| 30-1-2017 | kWhGraph | 7,986 | 2,7 | 3,694 | € 0,00 | 4,1 |
| 31-1-2017 | kWhGraph | 3,691 | 1,2 | 1,707 | € 0,00 | 1,9 |
| Ajoutť | | 192,963 | | 89,245 | € 0,00 | |