Rendement par jour
| Onduleur | Wp | Initial | kWh/kWp | Production actuelle | kWh/kWp | % | Production | kWh/kWp | % |
|---|
| SMA SB3000TL20 | 2996 | 356,524 | 119,0 | 507,902 | 169,5 | 142,5% | 507,902 | 169,5 | 142,5% |
| Jour | | Production(kWh) | kWh/kWp | Co2 (Kg) | Gains | % |
|---|
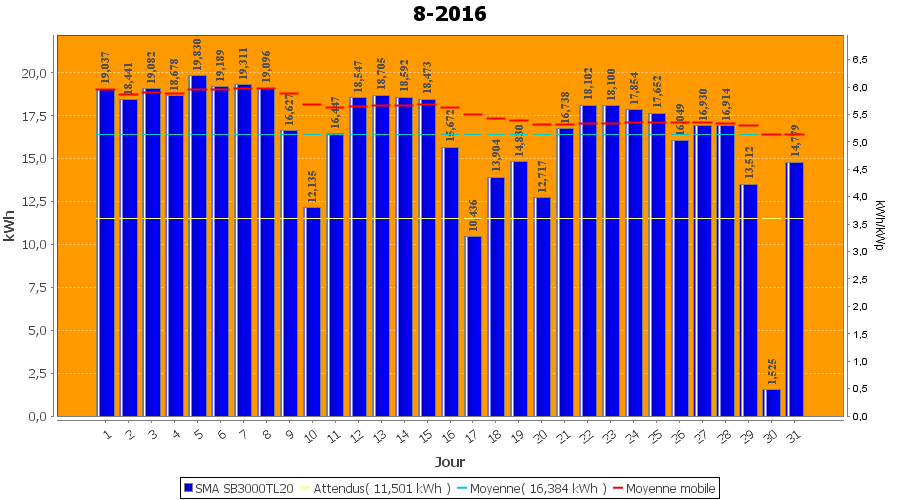
| 1-8-2016 | | 19,037 | 6,4 | 8,805 | € 0,00 | 3,7 |
| 2-8-2016 | | 18,441 | 6,2 | 8,529 | € 0,00 | 3,6 |
| 3-8-2016 | | 19,082 | 6,4 | 8,825 | € 0,00 | 3,8 |
| 4-8-2016 | | 18,678 | 6,2 | 8,638 | € 0,00 | 3,7 |
| 5-8-2016 | | 19,830 | 6,6 | 9,171 | € 0,00 | 3,9 |
| 6-8-2016 | | 19,189 | 6,4 | 8,875 | € 0,00 | 3,8 |
| 7-8-2016 | | 19,311 | 6,4 | 8,931 | € 0,00 | 3,8 |
| 8-8-2016 | | 19,096 | 6,4 | 8,832 | € 0,00 | 3,8 |
| 9-8-2016 | | 16,627 | 5,5 | 7,690 | € 0,00 | 3,3 |
| 10-8-2016 | | 12,135 | 4,1 | 5,612 | € 0,00 | 2,4 |
| 11-8-2016 | | 16,447 | 5,5 | 7,607 | € 0,00 | 3,2 |
| 12-8-2016 | | 18,547 | 6,2 | 8,578 | € 0,00 | 3,7 |
| 13-8-2016 | | 18,705 | 6,2 | 8,651 | € 0,00 | 3,7 |
| 14-8-2016 | | 18,592 | 6,2 | 8,599 | € 0,00 | 3,7 |
| 15-8-2016 | | 18,473 | 6,2 | 8,544 | € 0,00 | 3,6 |
| 16-8-2016 | | 15,672 | 5,2 | 7,248 | € 0,00 | 3,1 |
| 17-8-2016 | | 10,436 | 3,5 | 4,826 | € 0,00 | 2,1 |
| 18-8-2016 | | 13,904 | 4,6 | 6,431 | € 0,00 | 2,7 |
| 19-8-2016 | | 14,830 | 4,9 | 6,859 | € 0,00 | 2,9 |
| 20-8-2016 | | 12,717 | 4,2 | 5,882 | € 0,00 | 2,5 |
| 21-8-2016 | | 16,738 | 5,6 | 7,741 | € 0,00 | 3,3 |
| 22-8-2016 | | 18,102 | 6,0 | 8,372 | € 0,00 | 3,6 |
| 23-8-2016 | | 18,100 | 6,0 | 8,371 | € 0,00 | 3,6 |
| 24-8-2016 | kWhGraph | 17,854 | 6,0 | 8,257 | € 0,00 | 3,5 |
| 25-8-2016 | kWhGraph | 17,652 | 5,9 | 8,164 | € 0,00 | 3,5 |
| 26-8-2016 | kWhGraph | 16,049 | 5,4 | 7,423 | € 0,00 | 3,2 |
| 27-8-2016 | kWhGraph | 16,930 | 5,7 | 7,830 | € 0,00 | 3,3 |
| 28-8-2016 | kWhGraph | 16,914 | 5,6 | 7,823 | € 0,00 | 3,3 |
| 29-8-2016 | kWhGraph | 13,512 | 4,5 | 6,249 | € 0,00 | 2,7 |
| 30-8-2016 | kWhGraph | 1,525 | 0,5 | 0,705 | € 0,00 | 0,3 |
| 31-8-2016 | kWhGraph | 14,779 | 4,9 | 6,835 | € 0,00 | 2,9 |
| Ajoutť | | 507,902 | | 234,905 | € 0,00 | |